How to improve the page load time and rendering time for your ATG application!
How your users and customers perceive the speed of your site is critical. The faster and more responsive your site appears to them the better experience they have and the more likely they are to make a purchase. There are plenty of studies about page response time and abandonment, so I won’t rehash the “why” of it here.
There are three components that drive how responsive a page feels to an end user:
- Primary Page HTML response time
- Primary Page DOM parsing time
- Secondary Asset load time
The first component is driven by the server’s request processing time (DRP service time), the page’s HTML size, and the speed of the connection between your server and your end user’s computer.
The second component is driven by the size and complexity of the HTML DOM tree.
The third component is driven by the number of secondary assets, such as JavaScript, CSS, images, Flash, etc…, the size of those assets, the speed of the network connection to those assets, and the cache headers of those assets (to avoid having to load them for each page).
So, we have to look at file sizes, DOM complexity, number of files, cache headers, the speed of request handling on the server, and the network speed between the user and the server.
That’s a lot.
So where do we start?
First, let’s analyze where your weakest areas are.
Identify your most important pages. Typically this would include your home page, and your catalog navigation pages (assuming this is a commerce site). While the checkout flow is also critical, it’s much more likely to be constrained by the performance of the server-side checkout related processes.
Now that you have a list of pages to start with, you need to analyze them. The best set of tools to do this is thankfully free. Install the following, in order:
- Firefox – a great open source web browser
- Firebug – a web page debugging tool
- YSlow – an add-on to Firebug which provides performance specific information
Start Firefox, and if you’ve used it before, clear the caches before proceeding. Pull up your first page. At the bottom right of the Firefox window you will see the Firebug and YSlow buttons.

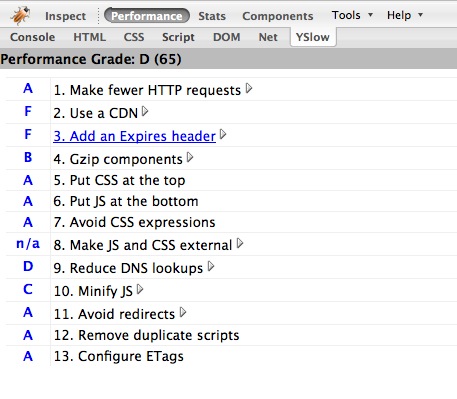
Click on the YSlow text. It will work some magic and then present a Performance Grade with a list of sub-section grades:
[fusion_builder_container hundred_percent=”yes” overflow=”visible”][fusion_builder_row][fusion_builder_column type=”1_1″ background_position=”left top” background_color=”” border_size=”” border_color=”” border_style=”solid” spacing=”yes” background_image=”” background_repeat=”no-repeat” padding=”” margin_top=”0px” margin_bottom=”0px” class=”” id=”” animation_type=”” animation_speed=”0.3″ animation_direction=”left” hide_on_mobile=”no” center_content=”no” min_height=”none”]
If your grade is bad, don’t despair. Some of it is nonsense, and some of it we will fix shortly.
Most of the sub-sections will expand to provide additional information.
Before we dive too deeply into this, let’s check out some of the other data YSlow and Firebug can provide.
The top tabs: “Performance”, “Stats”, “Components”, “Tools” are YSlow tabs.
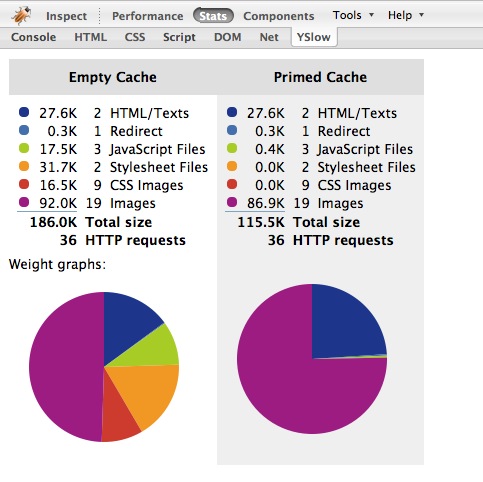
First, click on the “Stats” tab at the top of the YSlow/Firebug sub-window. This will show you the request and asset size/weight from both empty browser cache and primed browser cache states.
[/fusion_builder_column][fusion_builder_column type=”1_1″ background_position=”left top” background_color=”” border_size=”” border_color=”” border_style=”solid” spacing=”yes” background_image=”” background_repeat=”no-repeat” padding=”” margin_top=”0px” margin_bottom=”0px” class=”” id=”” animation_type=”” animation_speed=”0.3″ animation_direction=”left” hide_on_mobile=”no” center_content=”no” min_height=”none”]
Next click on the “Components” tab, which will display lots of data about all of the requests.
The lower set of tabs: “Console”, “HTML”, “CSS”, “Script”, etc… are Firebug tabs.
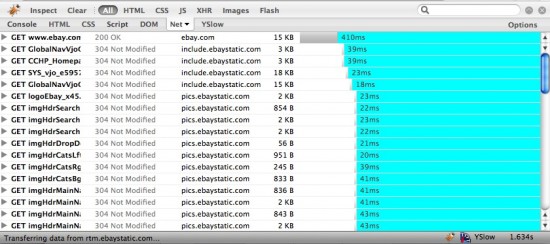
Click on the “Net” tab. You may need to select the “Net” support checkbox to enable this tab for this site. Then it will pull up all of the assets which were loaded to display the page, and show you the order they were requested in, their size, and how long each request took. it will also show you the total time needed to load the page at the far bottom right.
[/fusion_builder_column][fusion_builder_column type=”1_1″ background_position=”left top” background_color=”” border_size=”” border_color=”” border_style=”solid” spacing=”yes” background_image=”” background_repeat=”no-repeat” padding=”” margin_top=”0px” margin_bottom=”0px” class=”” id=”” animation_type=”” animation_speed=”0.3″ animation_direction=”left” hide_on_mobile=”no” center_content=”no” min_height=”none”]
At this point we have information such as how long the page took to render, how many requests were needed to render the page, how big each requested asset was, how long each request took to return, which assets were gzipped, which assets had caching related headers (and what those headers were), and much more.
This is the data we will need to optimize the end user’s experience of your site, and this data will provide a baseline to measure our improvement against.
So now you know where you stand. Since there is so much to cover, I’ll be breaking this into a few different posts. My next posts on the topic will cover how to improve in each area to make your site as responsive as possible.[/fusion_builder_column][/fusion_builder_row][/fusion_builder_container]
Leave a Reply to Performance Tuning Your ATG Application | Devon Hillard Tech Blog Cancel reply